Fundamentals of Warfarin Dosing

Efficacy of warfarin is determined by the attain and maintaining an INR (International Normalized Ratio) with a narrow range of usually 2-3. This requires consistent blood monitoring. INR is essentially a measure of how quickly blood will clot.

The unit Warfarin: The Fundamentals discusses the mechanism of action and drug interactions of warfarin in more detail.

Despite the availability of newer anticoagulants that offer the ease of standard dosing warfarin remains the drug of choice in specific patients where cost, renal function and specific diagnoses prevent the use the newer direct acting oral anticoagulants (DOAC). Because of this we need to know how to dose warfarin.

Patient Considerations

It takes a responsible patient to use warfarin correctly. A thorough social history is needed so that we can identify patients whose lifestyle would place them at risk of using warfarin incorrectly.

Image showing the elements of a patients social history that must be considered before prescribing warfarin. Social issues like drug addiction, homelessness, lac of transportation and cognitive impairment places a patient at risk for misuse of warfarin.

Patients with active drug use, cognitive problems, homelessness are likely to be inconsistent with their medication.

Patients must have reliable ways of getting to INR testing sites and to general medical care because of the increased risk of bleeding which needs to be addressed quickly.

The concern is both for efficacy and the adverse outcomes that can result from improper use and monitoring.

This article provides a deeper dive into the psychosocial issues that must be considered with the use of warfarin.

Dosing Considerations

If it hasn’t been made clear by now, warfarin is not a standard drug. Both dose and the corresponding INR can vary largely with each patient. Achieving steady state is vital in patients on warfarin because the drug is effectively offering no protection if we are below INR range. It is crucial to always keep this in mind. Don’t be too conservative with dosing that you effectively do not treat.

If INR is above the recommended range, the patient is at an increased risk for bleeding. Don’t be too aggressive either!

There are general dosing recommendations that should be considered so that there is a systematic and justifiable approach to initiating and adjusting doses.

I recommend the use of a dosing nomogram, knowing always that it is just the baseline from which you will adjust based on patient specifics.

Patient Specifics

Most nomograms provide recommendations based on an otherwise healthy patient. The usual initial dose is 5mg once daily. Starting with this initial dose we will then consider our patients characteristics and determine if we need to increase or decrease this initial dose.

I. Age:

Patients who are elderly (>65 year old) will typically start at half the dose (2.5mg).

Elderly patients have a higher risk of hemorrhagic events with anticoagulation. Starting a lower dose allows us to titrate to goal while minimizing that risk.

II. Nutritional Status:

Patients who are malnourished are at an increased risk of bleeding with warfarin.

Serum albumin levels are used as an assessment of nutritional status in clinical practice. Low serum albumin indicates malnutrition.

Over 90% of warfarin absorbed is bound to albumin. Only unbound warfarin is active and available for vitamin K antagonism. When serum albumin is low, a greater portion of absorbed warfarin exists in its active from, increasing the risk of bleeding.

In malnourished patients it would be wise to lower the starting dose.

Infographic showing the considerations for deviation from the standard initial dose of warfarin. age, nutritional status, comorbidities and drug interactions.
III. Comorbidities:

The 5mg starting dose of warfarin is recommended in patients who are, other than their need for anticoagulation, considered healthy.

In patients with liver disease, kidney disease, heart failure, cancer (to name a few) it maybe wise to start with a lower initial dose to minimize the risk of bleed. In patients with significant comorbidities there is a high rate of mortality in the event of a bleed.

IV. Drug Interactions

A complete medication review must be done for all patients started on warfarin. Some drugs can induce the metabolism of warfarin. This will reduce the anticoagulant effect and may require a high initial dose to get patient to goal.

Other medications by inhibit the metabolism of warfarin thus enhancing the anticoagulation effect and increasing the risk of bleed. These patients would require lower starting doses.

Other drugs may themselves have effects on coagulation that would add to that of warfarin, increasing the risk of bleed. The unit Warfarin: The Fundamentals covers drug interactions with warfarin in great detail.

All of these patient specifics must be weighed against any dosing nomogram. In most cases, your facility will have a protocol (their vetted nomogram) to guide dosing. The nomogram does not replace your clinical judgement.

Timing of Dose Changes

Once we’ve decided in an initial dose of warfarin (standard, lower or higher) we then need to consider the timing of INR monitoring and dose adjustment.

Patients newly started on warfarin, especially in the inpatient setting will have daily INR levels. We want to identify any abnormal increases in INR that will place the patient at an increased risk of bleed.

An increase in INR greater than 0.3 units in one day is not favorable. We would need to reduce the current dose to prevent overshooting our goal.

The Third Dose

The INR after the 3rd dose of warfarin is an important check point. On day 3 of consistent dosing we can make predictions about what the full effect of the current dose will look like in a few days.

We use the INR on day 3 to decide whether the current dose needs to be increased, decreased or stay the same.

Illustration showing the significance of the third dose of warfarin. On day 3 we are trending the effect of warfarin and are able to make a prediction  about the full effect of the current dose. This allows use to make changes to the dose if needed.

An INR<1.5 after 3 days of consistent dosing requires a increase in dose.

An INR >2 after 3 days of consistent dosing requires a decrease in dose.

An INR between 1.5-2 after 3 days of consistent dosing requires no change in dose.

Why 3 days?

Why would we decrease the dose if INR is within goal on day 3?

Warfarin works by inhibiting the production of clotting factors. It has no effect of clotting factors that were already produced prior to the initiation of warfarin. It does not destroy existing factors.

The longest half life of the the clotting factors affected is 72 hours (3 days): factor II. This means that it will take 3 days for any factor II that existed prior to warfarin to fall to just half of its concentration.

The full anticoagulant effect of warfarin will be seen when ALL the preexisting clotting factors have run their course. This will take ~ 5 days. If it is already therapeutic at day 3, it will be supratherapeutic on day 5 when all those preexisting clotting factors are depleted.

Illustration showing the contribution of both warfarin and clotting factors to INR when warfarin is initiated. Around day 5 all the clotting factors are depleted and we see the full effect of warfarin.

D1-D3 warfarin is anticoagulating while the preexisting clotting factors continue to coagulate and therefore affect INR. On D3-D5 there is still some coagulation by clotting factor II while warfarin is anticoagulating. Both warfarin and clotting factors continue to influence INR. After day 5, the only contributor to INR is the anticoagulation effect of warfarin.

INR is a Lag Value

An INR drawn today reflects the effect of the doses given on the prior 3-4 days. For example, if a patient has been on 5mg of warfarin with an subtherapeutic INR we can increase the dose to 7.5mg daily.

Illustration showing the lag effect of warfarin. You need atleast 5 days to see the full effect of a dose change. Any INR prior to that is simply trending the effect of warfarin. It can be used to predict the full effect.

We would need 3-5 days of consistent dosing to see the effect of the dose change. Analysis of INR must always be down with consideration of prior dosing. During that time levels may still be drawn to trend the effect of the dose change and identify any jumps in INR that that suggest we may overshoot our target.

Using the INR at day 3 of a stable dose, we can extrapolate an estimation of what the full effect of warfarin will look like in a couple of days and compensate for that by adjusting the dose if necessary.

Warfarin is considered well managed if your patient is within range 65-70% of the time.

Warfarin Patient Education

Patients on warfarin need full and complete education about what this drug is, why they are taking it, what the tests are…everything. All this information should be provided face to face but also in simple written format.

This is alot of complex information and it is unreasonable to expect a patient to understand it all in one conversation. However, there are some key monitoring points, summarized below, that all patients should commit to memory. Knowing these could prevent poor outcomes.

What every patient should know:

All patients on warfarin should receive comprehensive education in different formats. This infographic shows when a patient should seek help while on warfarin. Signs or risk of bleeding, sickness, pregnancy, new medications and dietary changes.

If you’ve found this unit helpful I would love to heart from you! Leave a question or comment below.

Subscribe

Subscribe to get the latest study unit in your inbox.

The information on this website is intended to be used solely for educational and informational purposes. While the content may be about specific medical and health care issues, it is not a substitute for or replacement of personalized medical advice and is not intended to be used as the sole basis for making individualized medical or health-related decisions.

How to Treat: Atrial Fibrillation

Atrial fibrillation is a disorder of cardiac muscle contraction caused by the uncoordinated flow of electric impulses.

Uncoordinated impulses result in weaker contractions. Weaker contractions results in incomplete emptying of atria and ventricles. Incomplete emptying leads to stagnant pools of blood. Stagnant pools of blood leads to formation of clots.

The unit Atrial Fibrillation: Where to Start covers the pathophysiology and categorization of atrial fibrillation.

Medical Management of Atrial Fibrillation

The greatest concern in patients with AF is the risk of stroke and pulmonary embolism.

15-20% of all strokes results from AF.

AF pharmacotherapy centers on:

  1. Risk Reduction: of thrombus formation and stroke
  2. Treatment: of thrombus and stroke

The course of treatment is dependent on a number of patient specific factors that places them in distinct categories.

Calculating Risk of Stroke in Atrial Fibrillation

There should be an attempt to mitigate any modifiable risk factors for AF throughout all the progressive stages of the disease.

These risk factors are also important because they are what we use to stratify patients for risk of stroke and in turn determine the course of treatment. We do this by using the CHA2DS2 VASc Score.

The CHA2DS2 VASc score is considered the most validated score for risk stratification of stroke in AF.

Most clinical trials for therapies concerning AF use this score to show efficacy making it the generally preferred score.

The score helps to determine the one year risk of thromboembolic event in a non- anticoagulated patient with non valvular AF.

The score provides guidance for which patients will benefit from oral anticoagulation to prevent stroke.

Each risk factor carries a score of 1 except history of stroke, TIA or thromboembolism and age >75 which carries a score of 2.

Congestive Heart Failure: the presence of signs and symptoms of either right or left ventricular failure or both.

Hypertension: A resting blood pressure >140 mm Hg systolic and/or >90 mm Hg diastolic on at least 2 occasions or current antihypertensive pharmacological treatment.

Diabetes: Fasting plasma glucose level ≥7.0 mmol/L (126 mg/dL) or treatment with hypoglycemic agent and/or insulin.

Thromboembolism: peripheral embolism or pulmonary embolism.

Vascular disease: prior MI, peripheral artery disease, or aortic plaque , coronary artery bypass surgery, intermittent claudication.

When To Anticoagulate in Atrial Fibrillation

Anticoagulation is recommended in patients with atrial fibrillation and an estimated annual risk of thromboembolic event > 2%. That risk translates to a CHA2DS2 VASc Score of > 2 in men and > 3 in women.

In patients with AF who are considered to have an intermediate annual risk of stroke i.e. between 1-2%, the use of anticoagulation can be reasonable.

Together, the patient and provider must decide between no treatment and treatment with anticoagulants.

Consideration of patient preferences and individual risk factors is crucial.

There are decision aid programs available to help guide patients with choices for stroke reduction therapy.

Illustration of when to anticoagulate in atrial fibrillation

Risk of Bleed with Anticoagulation

The greatest risk assumed with the use of anticoagulation is the risk of major bleed. There must be an assessment of the risk of bleed with treatment versus the risk of stroke or thromboembolic event with no treatment.

Bleeding risk scores are risk stratification tools to help identify patient risk of bleed with anticoagulation.

The 3 most used bleed risk score are: HAS-BLED, HEMORR2HAGES and ATRIA

the relationship between bleeding risk scores and eligibility for anticoagulation

It is crucial to understand that bleed risk scores cannot be used in isolation to determine whether a patient should receive anticoagulation or not. It is a tool to support this decision.

Bleeding risk scores are very limited in their predictive value for bleed because the assessment uses many of the same risk factors that are used for risk of stroke. This includes factors like age, hypertension, renal disease, and previous stroke.

The 2023 guidelines are very clear: in patients who are categorized as high risk for stroke bleeding risk scores should not be used in isolation to determine eligibility for anticoagulation.

We want to manage the risk of bleed. Which means we need to identify modifiable risks of bleed in high risk patients and minimize them.

This includes interventions such as discontinuing and avoiding the use of other medications that can heighten bleeding risks like antiplatelet therapies and NSAIDs. Management of hypertension and alcohol consumption are other ways to minimize risk of bleed.

Reassessing Risks

AF is a lifelong disease. A patient’s characteristics, risk factors, preferences and lifestyle are likely to change over time.

It is therefore necessary to reassess a patient’s risk for stroke, risk of bleed, compliance and preferences periodically to determine if any changes in therapy are needed. This is usually done at annual medical visits.

Overview of Pharmacotherapy in Atrial Fibrillation

Medical management of AF centers on:

oral anticoagulation rate control rhythm control

pharmacotherapy for atrial fibrillation

Each of these will be tackled individually in separate post.

If you’ve found this unit helpful I would love to hear from you! Leave a question or comment below.

Subscribe

Subscribe to get the latest study unit in your inbox.

The information on this website is intended to be used solely for educational and informational purposes. While the content may be about specific medical and health care issues, it is not a substitute for or replacement of personalized medical advice and is not intended to be used as the sole basis for making individualized medical or health-related decisions.

Statistics: How to Calculate Specificity in 3 Steps

Specificity is descriptive of a test. It describes the probability that the test will correctly not detect a diagnostic marker in a patient where it is truly absent. Calculating statistical specificity can be done in 3 simple steps.

Sensitivity and specificity are often explained together. I think this is mostly done by convention even though tying them together can make the concepts seem more confusing. The ability to calculate specificity and sensitivity from one grid may also influence the tendency to group them together.

Sensitivity and specificity are independent descriptors of a test that focus on different parts of a population and test for opposing outcomes. Orienting to the appropriate population is the key step is understanding sensitivity and specificity. Because of this I address them in separate units.

You can find the unit on sensitivity here.

Need for Specificity

Most diagnostic tests are not 100 percent accurate.

To perform a diagnostic test we take body samples and measure the presence and quantity of a specific substance. We then compare that value to standardized ranges to help rule in or rule out the presence of pathology.

A diagnostic test is accurate when:

  1. it has identified the presence of a diagnostic marker in sufficient quantities in a patient who truly has the pathology associated with that marker (sensitivity)
  2. it fails to detect the presence of diagnostic marker in a patient where the pathology is truly absent (specificity)

This does not always happen.

Sometimes, the test will detect the presence of diagnostic markers in patients that do not the associated pathology. Sometimes it can fail to detect in patients who truly have the pathology.

Sensitivity and specificity provide of an assessment of how reliable the results of test are. This must be considered when making a diagnosis.

Detecting Absence

Specificity detects absence.

When calculating statistical specificity we must orient ourselves to the part of the population where the the diagnostic marker is truly absent i.e. no disease is present.

The tested population of absence includes:

  1. true-negatives: disease is absent and test results negative
  2. false-positives: disease is absent but the test results positive

This is the first key step is calculating statistical specificity.

Specificity in 3 Steps

Illustration showing the 3 steps required for calculating statistical specificity of a test

Determine the total number of patients tested with absence of diagnostic marker/disease (true negatives + false positives)

Determine how many of those patients had a negative test result (true negative)

Divide the number of true negatives (2) by the sum of true negatives and false positives (1)

Rule In

Because specificity refers to how well a test can detect absence it also means that when the test detects presence (i.e. a positive test result) we can have a high degree of confidence that the diagnostic marker is truly present.

You can think about a test with high specificity as a carbon monoxide detector. It spends most of its time scanning the room ensuring that there is no carbon monoxide (detecting absence). If it does alert (positive result) we are going to act immediately because we can reliably rule in the presence of carbon monoxide.

A test with high specificity is useful for ruling IN a disease when the result is positive.

Specificity Equation

Image showing the equation for calculation of statistical specificity

Sensitivity versus Specificity

The key distinction that has to be made between sensitivity and specificity is the population of focus.

Image showing the comparison of specificity and sensitivity. The key difference between the focus on the part of the population with disease and without disease.

Sensitivity detects presence: we use only those patients where the disease/diagnostic marker is truly present regardless of the test i.e. true positive and false negatives

Specificity detects absence: We use only those patients where the disease/diagnostic marker is truly absent regardless of the test i.e. true negatives and false positives

Specificity Calculations

Calculating statistical specificity can be performed intuitively or with placement on a grid. The key with either method is understanding that you are focused on absence when calculating specificity.

Specificity can be used in more advanced calculations like negative predictive value and negative likelihood ratio.

Fundamentals Of Biostatistics is a book that you will reference throughout your academic and professional career.

If you’ve found this unit helpful, I would love to hear from you. Leave a comment of question below.

Subscribe

Subscribe to get the latest study unit in your inbox.

The information on this website is intended to be used solely for educational and informational purposes. While the content may be about specific medical and health care issues, it is not a substitute for or replacement of personalized medical advice and is not intended to be used as the sole basis for making individualized medical or health-related decisions.

Statistics: How to Calculate Sensitivity

To perform a diagnostic test we take body samples and measure the presence and quantity of a specific substance. We then compare that value to standardized ranges to help rule in or rule out the presence of pathology. One way we do this is by calculating sensitivity.

A diagnostic test is accurate when:

  1. it has identified the presence of a diagnostic marker in sufficient quantities in a patient who truly has the pathology associated with that marker.
  2. it fails to detect the presence of diagnostic marker in a patient where the pathology is truly absent.

This does not happen every time. Most diagnostic tests are not 100 percent accurate.

Sometimes, the test will detect the presence of diagnostic markers in patients that do not the associated pathology. Sometimes it can fail to detect in patients who truly have the pathology.

Detecting Presence

Sensitivity detects presence. It focuses on the part of the population that truly has the diagnostic marker.

The expected proportion of times a diagnostic test will positively detect a diagnostic marker, in sufficient quantities, in a patient who truly has a disease is known as its sensitivity.

The higher the sensitivity, the more likely a test will identify true patients with diagnostic markers for disease.

Because sensitivity indicates a high ability to detect presence of a diagnostic marker, this also means that if it detects nothing, it is very likely that the diagnostic marker is truly not present. Test with high sensitivity are therefore useful for ruling OUT disease.

.

Detection Dogs

Tests with high sensitivity are like police detection dogs. They are trained to be very sensitive to scents. They help to sniff out explosives, illegal drugs, criminals etc. and will alert their handler when they detect a specific scent (true positive).

If the target scent is not there, they will not alert the handler (true negative).

Detection dogs, like diagnostic tests, don’t always get it right. They have a hard time distinguishing contamination or residual scent from the desired target. They maybe be influenced or distracted by what is going on around them. So there is the potential for false-positives (they alert when there is nothing there) and also false-negatives (they fail to alert when the target is there).

Chart showing the analogy of sensitivity as the detection dog of medicine.

Sensitivity is the medical detection dog.

These tests are very good at sniffing out the presence diagnostic markers. No alert (negative test result) can reliably rule out the presence of a diagnostic marker.

If they detect nothing, there is a high probability there is nothing there.

4 Sensitivity Outcomes

True Positive: alert + disease present
illustration showing true positives as the detection of diagnostic marker when disease is truly present.

This is one of our two diagnostic ideals.

This is the proportion we are trying to figure out when we calculate sensitivity.

However much like our detection dogs there are things that can influence the ability to detect.


False Negative: no alert + disease present

This would be a missed diagnosis.

This is where those distractions and residuals that can affect our medical detection dog come into play.

The marker is there but the dog missed it.

illustration showing false negatives as the absence of an alert when a diagnostic marker is truly present

False Positive: alert + no disease
Illustration showing false positives as the presence of an alert when a diagnostic marker is not present

Our medical detection dog (sensitivity) is very unlikely to smell something that is not there but it is possible.


True Negative: no alert + no disease

No scent, no alert.

This is our second diagnositic ideal.

illustration showing true negatives as the absence of an alert when there is truly no diagnostic marker present

Sensitivity Calculation

Diagram showing the equation for calculation of sensitivity as the number of true positives divided by the the sum of true positives and false negatives.

Sensitivity calculations are descriptive of the test, not the diagnosis. When we calculate sensitivity we only include the values where the marker is actually present. Sensitivity focuses on those patient we truly have the disease regardless of detection by the test, This would include both true-positives and false-negatives.

The sum of true positives and false negatives is the number of patients who truly have the disease regardless of detection by the test. This is the population we are concerned about when we calculate sensitivity of a test.

We calculate sensitivity by dividing the number of diagnostic markers detected by the total number of markers present.

Using our detection dog analogy, we divide the number of times our dog accurately alerts to the total number of times he should have alerted.

Sensitivity Grid

We can lay out our values on a grid to calculate sensitivity.

Calculating sensitivity centers on true positive and true negative values i.e. those patients who truly have the disease (see equation above).

Sensitivity in 3 Steps

  1. Determine the total number of patients tested with presence of diagnostic marker/disease (true positives + false negatives)
  2. Determine how many of those patients had a positive test result
  3. Divide the number of positive results (2) by the total presence population (1)

Calculations

Image showing an example calculation of sensitivity.

Sensitivity is a fundamental calculation that can be further applied to more complicated calculations like positive predictive value and positive likelihood ratio.

Calculating sensitivity is also commonly grouped together with specificity. I have opted to separate the two so that we can understand each value individually.

Books on statistics that I’ve found helpful:

If you’ve found this unit helpful I would love to hear from you! Leave a question or comment below.

Subscribe

Subscribe to get the latest study unit in your inbox.

The information on this website is intended to be used solely for educational and informational purposes. While the content may be about specific medical and health care issues, it is not a substitute for or replacement of personalized medical advice and is not intended to be used as the sole basis for making individualized medical or health-related decisions.

Acute Coronary Syndrome: What You Need to Know

Acute coronary syndrome (ACS) is an umbrella term used to describe any condition that causes a sudden decrease in blood supply to heart muscles.

The heart supplies oxygen and nutrients to all tissues in the body including itself.

Image showing coronary arteries surrounding heart muscles that are affected in acute coronary syndrome

The heart is wrapped in tiny blood vessels called coronary arteries that supply the heart with oxygen and nutrients it needs to function.

Interruption to blood flow through the coronary arteries will results in death of the tissues that it supplies.

Timely identification of patients with acute coronary syndrome will minimize cardiac cell death and preserve cardiac function.

Patient Presentation

Patients will commonly complain of feeling pressure in the chest that spreads out to the arms and jaw even when they are resting or with minimal activity. This is accompanied by excessive sweating, nausea and shortness of breath.

Patients often initially describe it as bad case of heartburn. Shortness of breath and radiating pain should lead you to a more worrisome diagnosis.

ACS has an in hospital mortality rate of up to 26%. It is very important to be able to identify patients with potential ACS. Treatment options are time sensitive.

Illustration showing orders for a patient presenting with acute coronary syndrome. Includes a a 12 lead ECG, aspirin and cardiac troponins.

If ACS is suspected, a 12 lead ECG and aspirin should be given within 10 mins.

Cardiac troponin levels should also be ordered.

The sooner we correct blockage the more muscle we save. The strength of contraction of heart muscle is the driving force of blood circulation.

Early intervention in ACS helps to preserve heart function.

Pathophysiology

Atherosclerotic Plaque

The most common cause of reduced blood flow to the heart is the rupture of plaque that has accumulated within blood vessels. This build up is referred to as atherosclerosis.

Illustration of an artery with blood flow restricted by the build up of plaque inside the walls of the vessel.

Atherosclerotic plaque is the build up of fatty tissue, cholesterol and other materials on the inner walls of arteries.

In addition to the build up itself reducing the diameter of the vessel and therefore blood flow, the plaque can break open and cause damage to the lining of vessel.

This stimulates an immune response at the site of injury. Macrophages, neutrophils and platelets rush to the site of injury forming a clot in an attempt to repair the rupture. This unfortunately further narrows the pathway for blood flow.

Pieces of plaque or pieces of the thrombus can also break off and be carried by the flow of blood. These fragments can cause blockage when they get to smaller vessels like coronary arteries. This is referred to as embolization.

Illustration showing how plaque build up in the arteries can lead to clot formation. Injury to the plaque stimulates an immune response that stimulates clot formation around the injured vessel, further restricting blood flow. Parts of the clot can embolize (break off) and clog off smaller vessels like coronary arteries.

Coronary Spasms

Less commonly, acute coronary syndrome can occur in the absence of atherosclerotic plaque formation via coronary vasospasm. This is a sudden narrowing of coronary arteries which restricts blood flow to the heart.

Assessment

Cardiac Troponins

Cardiac troponins are proteins that regulate contraction of heart muscles.

Muscle contraction happens when actin and myosin (filaments that make up muscle fibers) connect and slide past each other.

In the presence of intracellular calcium, cardiac troponins will alter binding sites so that actin and myosin can interact. Binding initiates the filament slide which we see as cardiac contraction.

As heart muscles die from prolonged lack of oxygen and nutrients, cardiac troponins are released from dying cells into blood.


ST Segment

Illustration showing a normal ECG wave with the QRS wave, the T wave and the ST segment in between.

The QRS wave on ECG is ventricular depolarization. During this time an electrical signal moves through the ventricles.

This triggers voltage gated sodium and calcium channels to open. The influx of positive ions stimulates muscle contraction.

The T wave on ECG is ventricular repolarization. The voltage gated channels close and potassium moves out. The heart muscles relax.

The ST segment on an ECG is the time between the end of ventricular depolarization and start of repolarization.

During this time the heart remains contracted, expeling blood into systemic circulation.

The ST segment is considered electrically neutral. It normally lies flat at baseline.

In ACS, the direction of displacement of the ST segment from neutrality is used to differentiate between the 2 broad categories of ACS and determine treatment.

NSTE-ACS & STEMI

NSTE-ACS and STEMI are the 2 broad categories of ACS.

Illustration showing the zones of the ECG where the ST segment would be observed in ST elevation versus ST depression when doagnosing acute coronary syndrome

When there is complete blockage of flow we will see ST elevation.

ACS with ST elevation is classified as a STEMI.

As long as blood flow to some healthy tissue can still be achieved we will see ST depression.

ACS with ST depression is classified as Non ST Segment Elevation-ACS. In NSTE-ACS blockage in incomplete.


NSTE-ACS can be further broken down into unstable angina (UA) and NSTEMI.

UA and NSTEMI are differentiated by the absence or presence of cardiac troponins.

Illustration showing how to differentiate between the 3 types of acute coronary syndrome in three simple steps

I. Unstable Angina

In UA there is partial occlusion of the coronary arteries. Since there is still blood flow with occlusion we see ST depression. The blockage is not sufficient to cause cell death (no myocardial infarction) so troponins levels will not increase.

Unstable angina (UA) will show ST depression and negative troponins.

II. NSTEMI

In non ST elevated myocardial infarction, there is partial occlusion sufficient to cause some call death. Because blood flow can still be directed to some healthy tissue we see ST depression. Because there is some cell death we see in a rise in cardiac troponins.

III. STEMI

In ST elevation myocardial infarction there is complete occlusion. Because there is no pathway for blood flow to healthier tissues we see ST elevation. No blood flow means cell death in inevitable, we see a significant rise in cardiac troponins.

Illustration comparing the ST segment and cardiac troponin levels in unstable angina, NSTEMI and STEMI.

4 Treatment Groups for ACS

In non STE-ACS (unstable angina and NSTEMI) the goal of treatment is to prevent complete occlusion as soon as possible.

In STEMI the goal of treatment is to restore perfusion as soon as possible.

This is achieved mechanically via a medical procedure known as percutaneous coronary intervention (PCI) where the affected artery is accessed and the blockage circumvented with a stent. This involves the use of antiplatelet medication and anticoagulation.

Perfusion can also be reestablished pharmaceutically with a combination of antiplatelet medications, anticoagulants or fibrinolytics.

The choice of therapy is dependent mainly on the category of ACS (UA, NSTEMI or STEMI) and patient stability.

Illustration of the treatment option in ACS. This includes ischemia directed therapy. percutaneous coronary intervention and fibrinolysis.

Each of these interventions will require their own unit.

As always you can dive right into the guidelines for the management of patients with acute coronary syndrome. Knowing the fundamentals presented here will give you a good framework to navigate those guidelines.

Check out our other cardiac units on Acute Heart Failure and Atrial Fibrillation.

If you’ve found this unit helpful I would love you hear from you! Leave a comment or question below.

Subscribe

Subscribe to get the latest study unit in your inbox.

The information on this website is intended to be used solely for educational and informational purposes. While the content may be about specific medical and health care issues, it is not a substitute for or replacement of personalized medical advice and is not intended to be used as the sole basis for making individualized medical or health-related decisions.

Acute Heart Failure: A Comprehensive Overview of Pathophysiology

Image showing circulation cycle of blood from the heart, throughout body tissue, back to the heart and then the lungs.

The main function of the heart is to pump oxygenated blood from the heart, throughout the body, and return oxygen depleted blood to the lungs. This cycle takes only 13 seconds and is interrupted in acute heart failure.

The contraction of heart muscles, the resistance of blood vessels and valves all maintain the pressure and direction of flow to complete the circulation cycle.

Blood Pressure

Blood pressure is a measure of the force of blood as it is pushed through circulation. We measure 2 values:

Blood pressure is reported as SBP/DBP.

Pathophysiology

In heart failure the heart muscles become weak. They lose contractility and the walls of the heart start to stretch.

Think of the stretch in new knit sweater versus the looseness after it has been through the wash a few times.

The heart is not able to fill up with blood or contract normally. The overall result is less pressure and less volume of blood per pump. The circulation pathway is compromised.


B-type Natriuretic Peptide

When the heart muscle stretches it releases a hormone called proBNP. ProBNP immediately splits into B-type Natriuretic Peptide (BNP) and N-terminal pro-BNP (NT-proBNP).

BNP is biologically active. It attempts to compensate for heart failure by signaling blood vessels to dilate or widen. This will reduce the pressure in systemic circulation that the failing heart has to pump against.

BNP also stimulates the kidneys to increase sodium and water excretion. This will decrease the amount of blood returning to the heart (the preload), which takes some pressure off the weakened heart muscles.

Image showing stretched heart muscles in acute heart failure release proBNP. ProBNP then breaks sown into active BNP and NT-proBNP. BNP then causes vasodilation and increased excretion of sodium and water by the kidneys. This helps to compensate for the failing heart.

In acute heart failure, levels of BNP and NT-proBNP will rise significantly. The stretched heart muscles are releasing proBNP is large quantities so that blood vessels and the kidneys can try to compensate.

Both levels can be tested and used as a diagnostic criteria in combination with patient presentation for acute decompensated heart failure.

Impaired function can happen gradually over time (chronic heart failure) or suddenly (acute heart failure). This unit is focused on acute heart failure.


Compensation

The body will interpret decreases in pressure and output from the heart as low blood pressure. To correct this the kidneys will increase sodium and water retention to increase blood volume. This is the opposite of what BNP is asking the kidneys to do.

Image showing how the kidneys compensate in acute heart failure. As the outflow of blood from the heart into blood vessels decreases, the kidneys increase the amount of sodium and water it retains to increase the volume of plasma in blood vessels. This helps to maintain blood pressure.

The blood vessels will also constrict in an attempt to increase pressure and facilitate tissue perfusion. This is the opposite of what BNP is asking the vessels to do.

Illustration showing how blood vessels compensate in acute heart failure. As the volume of blood pumped out by the heart decreases, blood vessels will constrict to increase pressure. This will help to maintain the pressure needed to get blood to distant tissues.

This compensation unfortunately makes it even more difficult for an already failing heart. It now has to pump against even higher resistance from the vessels.

Image showing the opposing compensations that happen in heart failure. Stretch heart muscles release a hormone BNP that tries to relieve pressure on the by  reducing blood volume and increasing vasodilation. While the kidneys sense low blood pressure and do the exact opposite.

In heart failure, the body is essentially fighting against itself.

This a very delicate balance of compensation triggered by BNP release and opposing compensation triggered by hypoperfusion.

When balance can be maintained a patient will be in compensated heart failure.

Tipping the balance can trigger acute decompensated heart failure.

Acute decompensated heart failure (ADHF) occurs when:

1. hypoperfusion compensation can no longer keep up with decreased cardiac output and BNP compensation causing hypoperfusion of tissues and organs

2. renal compensation triggering increased sodium and fluid retention outweighs BNP compensation leading to fluid congestion

Hypoperfusion

Hypoperfusion is the result of reduced cardiac output coupled with BNP’s triggering of vasodilation and reduced blood volume. Every organ in the body will be affected by hypoperfusion.

It reduces oxygen and nutrient availability. Signs and symptoms of patients presenting with hypoperfusion include:

Illustration of the different organs that are affected by hypoperfusion in heart failure. It includes the heart at the center surrounded by the intestines, the brain, the extremities, the liver and the kidenys.

Altered alertness and cognition from decreased cerebral perfusion

Cold extremities from decreased perfusion to distant tissues

Accumulation of metabolic waste from decreased perfusion to kidneys and liver

Cardiac Output

Cardiac output can be measured as an estimation of hypoperfusion. It is the amount of blood pumped by the heart each minute.

Normal cardiac output is 4-7 L/min. In acute heart failure it can be 2-4 L/min. Typically a cardiac output of ~2.2L/min or lower indicated significant hypoperfusion.

Cold and Warm

Not all patients with acute decompensated heart failure will have low cardiac output.

If they do we describe them as cold. If they are perfusing normally, we described them as warm.

Congestion

Congestion in acute decompensated heart failure is the result of fluid accumulation. This occurs from the kidneys attempt to restore blood pressure by retaining sodium and water.

The heart muscle may also be too weak to accept venous return from systemic circulation so plasma pools in the venous system. Like hypoperfusion, fluid congestion has systemic implications.

As excess fluid accumulates it infiltrates organs and other body tissues. Signs and symptoms of patients presenting with congestion in ADHF include:

Illustration showing how fluid accumulation in heart failure affects different parts of the body. It shows swollen legs for edema, fluid filled lungs for shortness of breath, man sitting in chair for orthopnea. 
It shows a fluid filled abdomen for ascites. A swollen liver for hepatomegaly. A swollen neck for jugular distention and a swollen spleen for splenomegaly.

Swelling in the extremities (hands, arms, feet, ankles, legs) as fluid seeps into those tissues. This is known as edema.

Shortness of breath with activity and/ or at rest as fluid accumulates in the lungs. On examination, we hear rales (a rattling or bubbling sounds in the lungs).

Difficulty breathing when lying down. This is known as orthopnea.

Fluid accumulation can occur in the abdomen causing ascites, in the liver causing hepatomegaly and in the spleen causing splenomegaly.

A classic sign of increased fluid accumulation in the atria is jugular vein distention. The neck vein will visibly protrude.

Pulmonary Capillary Wedge Pressure

Fluid congestion in ADHF is measured by the pulmonary capillary wedge pressure (PCWP). A device is placed into the heart where it measures the pressure in the left atrium.

Normal PCWP is 8-12 mmHg. In ADHF it is 18-30mmHg.

Measuring PCWP is considered an invasive procedure. In practice it is not routinely performed. We rely on the symptoms we just discussed as markers of fluid overload.

Wet and Dry

Not all patients with ADHF will have fluid congestion.

If they do we describe them as wet. If they are euvolemic, we described them as dry.

4 Subsets of ADHF

When a patient presents with acute decompensated heart failure, we categorize them based on the absence or presence of hypoperfusion and the absence or presence of congestion. This creates 4 categories of ADHF.

I. Warm & Dry

These patients have adequate perfusion and no fluid accumulation. They are in ADHF heart failure which is identified by an elevated BNP or NT-proBNP but their body is able to balance BNP compensation and hypoperfusion compensation.

II. Warm & Wet

These patients have adequate perfusion but have signs and symptoms of fluid accumulation like edema, orthopnea. Hypoperfusion compensation outweighs BNP compensation at the kidneys.

III. Cold & Dry

These patients have low perfusion but so symptoms of fluid accumulation.

IV. Cold & Wet

These patients have low perfusion and fluid accumulation.

Illustration showing the 4 categories of acute decompensated heart failure based on symptoms of fluid congestion and hypoperfusion. It has 4 quadrants. Upper left shows warm and dry. Upper right shows warm and wet. Bottom left shows cold and dry. Botom right shows cold and wet.

Treatment

Management of ADHF is determined by which of those 4 categories best represents the patient.

We use intravenous diuretics to alleviate fluid congestion.

Intravenous vasodilators reduce the preload and systemic vascular resistance.

Ionotropes are used to increase the contractility of the heart when systolic blood pressure falls below 90mmHg.

Final Thoughts

With the information in this unit, you have a great foundation to delve into and really understand the AHA/ACC/HFSA Heart Failure Guidelines. Check out our other units in cariology:

Acute Coronary Syndrome: What You Need to Know

Atrial Fibrillation: Where to Start

If you’ve found this unit helpful I would love to hear from you! Leave a question or comment below.

Subscribe

Subscribe to get the latest study unit in your inbox.

The information on this website is intended to be used solely for educational and informational purposes. While the content may be about specific medical and health care issues, it is not a substitute for or replacement of personalized medical advice and is not intended to be used as the sole basis for making individualized medical or health-related decisions.

How to Assess Renal Function: 3 Blood Markers & Calculations

Normal renal function supports all organs in maintaining homeostasis. The kidneys are responsible for many critical processes in the body.

Image showing the process that are maintained with normal renal function

Filtration: the kidneys remove waste products like urea and creatinine which accumulate as a byproduct of normal metabolic processes.

Fluid Balance: The kidneys regulate how much water is eliminated and reabsorbed. Which in turn contributes the maintenance of blood pressure.

Electrolyte Balance: The kidneys maintain the balance of electrolytes in plasma. Which in in turn maintains normal cellular function, plasma pH, osmolarity and bone strength.

Red Blood Cells: The kidneys produce erythropoietin, a hormone that stimulates the production of red blood cells.

Normal renal function varies with age, gender and body size and naturally declines as we age.

Renal Structure

Image showing the cross section of the kidney including the glomerulus
Renal Artery

Plasma enters the kidneys via the renal arteries. This plasma contains the waste products of metabolic processes as well as the good stuff in blood: blood cells, clotting factors, nutrients, hormones, salts to name a few.


Glomerulus

As plasma moves through the blood vessels into the kidneys it will encounter the glomerulus.

The glomerulus is a network of tiny vessels arranged in a cluster inside the kidneys. This is where filtration occurs.

What is filtered by the glomerulus is determined by the size and charge of the molecules. Water moves freely through the glomerulus.

Image showing the structure of the Bowman's capsule within the glomerulus

Filtered molecules collect into the Bowman’s capsule before entering the renal tubules.


Renal Tubules

The renal tubules are the vessels that collect water and molecules that have been filtered by the glomerulus. This is the initial formation of urine. There are distinct sections of the renal tubules that have differing functions.

Detailed image of the structure of the renal tubules
  1. Proximal Tubule
  2. Descending Loop of Henle
  3. Loop of Henle
  4. Ascending Loop of Henle
  5. Distal Tubule
  6. Collecting Ducts

As urine moves through the tubules there is reabsorption of some components back into plasma as well as active secretion from plasma into the tubules.

The final urine product exists the kidneys via the collecting ducts and empties into the bladder.

Together the glomerulus and the renal tubules make up the nephron. The nephron is the basic unit of the kidneys. There are approximately 1 million nephrons in each kidney.

Measuring Renal Function

1. Creatinine

Creatinine is a waste product of creatine degradation. Our bodies derive creatine from protein metabolism and uses it to store energy in muscle as creatine-phosphate. Once creatinine-P has donated it phosphate stores to make energy in the muscle, it once again becomes creatine. Creatine will naturally degrade overtime to become creatinine which is then cleared from the body by the kidneys.

Illustration showing how serum creatinine is produced. The liver creates creatine from protein in our diet, Creatine is then stored in muscle where it is used to create energy is the form of ATP. Once energy is expended creatine is released, it degrades into creatinine which is released by the muscle and cleared by the kidneys with normal renal function
Creatine-P = creatine phosphate, ADP = adenosine diphosphate, ATP = adenosine triphosphate

Creatinine levels can be affected by factors such a muscle size, age and diet.

We use the waste product creatinine as a marker of renal function. Normal plasma creatinine levels range from 0.6-1.2 mg/dL. If creatinine levels exceed this the kidneys are not filtering blood as they should.


2. Blood Urea Nitrogen

Ammonia is a toxic byproduct of protein metabolism. It is converted to urea by the liver. Urea is then cleared by the kidneys.

Urea accumulation as a marker of impaired renal function

The accumulation of urea is another marker that suggests the kidneys are not clearing as they should. It is measured as the BUN. Normal values range from 6-24 mg/dL.


3. Cystatin C

Cystatin C is protein that is produced by all the cells in the body. It is produced at a constant rate independent of age, gender and muscle mass. Once it is released into blood it is cleared by the kidneys. Its clearance is considered to be a more reliable marker for estimation of renal function rather than Scr.

Calculation of Creatinine Clearance

1. Cockcroft-Gault Equation

The Cockcroft-Gault equation uses serum creatinine in the calculation of creatinine clearance (CrCl) as a measure of renal function. The equation considers the rate of clearance of creatinine relative to a person’s age, weight and gender compared to standard benchmarks.

Cockcroft gault equation for calculation of renal function.
CrCl = mL/min/BSA
SCr = standardized serum creatinine in mg/dL
age = years
weight = kilograms

Because Scr is used in the denominator low Scr will result in a higher calculated CrCl. In patients who are underweight, vegetarian or elderly SCr tends to be lower. Their CrCl can be overestimated when calculated by the Cockcroft-Gault equation even in the presence of renal impairment.

This equation was previously the standard for estimation of renal function in clinical trials for many of the drugs that are currently on the market. Renal dosing recommendations from these studies are based on CrCl.

The normal range for CrCl is > 97 mL/min in men and > 88 mL/min in women.

As the superiority of Cystatin C becomes more established estimation of renal function by the glomerular filtration rate (GFR) has become the standard.


2. Glomerular Filtration Rate

The glomerular filtration rate (GFR) estimates how much blood is filtered at the glomerulus each minute. Though it can be measured directly, it is a complicated test. Instead a calculation of estimated GFR is used.

GFR equation for calculation of renal function
eGFR = estimated GFR in mL/min/1.73 m2
SCr = standardized serum creatinine in mg/dL
Scys = standardized serum cystatin C in mg/L
κ = 0.7 (females) or 0.9 (males)
α = -0.219 (females) or -0.144 (males)
min = indicates the minimum of SCr/κ or 1
max = indicates the maximum of SCr/κ or 1
age = years

The equation is a bit complicated. In practice it will be calculated and reported as part of the patients labs. It uses a combination of SCr and serum cystatin (Scys) to estimate renal function. Because cystatin C production is not affected by muscle mass, gender and a diet it is a better estimate of renal function.

There are 2 other version of this equation that uses Scr only and Cystatin only. The option of using Scr remains simply because SCr test are more widely available and more cost effective.


3. BUN/Scr Ratio

BUN and creatinine used for this calculation are both measured in plasma. Both are cleared by the kidneys at the glomerulus. A normal value for this ratio is 10-15:1. Anything above or below this value indicates that there is some renal dysfunction. In addition to indicating the presence of renal injury, the BUN/Scr ratio is one of five markers that we can use to identify the origin of renal injury based on location.

Interpretation of Results

How we interpret these three calculated values depends on whether renal injury is acute or chronic. Each of these categories are deserving if their own unit but briefly:

Acute Kidney Injury

Acute Kidney Injury (AKI) is a decrease in kidney function or GFR over hours, days, or even weeks. The Kidney Disease: Improving Global Outcomes (KDIGO) guidelines define AKI as:

  1. An increase in SCr of 0.3 mg/dL or more within 48 hours; or
  2. An increase in SCr > 1.5 times baseline within last 7 days
  3. Urinary volume less than 0.5 mL/kg/hour for at least 6 hours

Chronic Kidney Disease

The Kidney Disease Outcomes Quality Initiative (KDOQI), defines chronic kidney disease (CKD) as:

abnormalities of kidney structure or function, present for >3 months and requires one of two criteria for >3 months: either GFR <60 ml/min/1.73 m2 or markers of kidney damage, including albuminuria. 

KDOQI

If you’ve found this unit helpful I would love to hear from you! Leave a question or comment below!

Subscribe

Subscribe to get the latest study unit in your inbox.

The information on this website is intended to be used solely for educational and informational purposes. While the content may be about specific medical and health care issues, it is not a substitute for or replacement of personalized medical advice and is not intended to be used as the sole basis for making individualized medical or health-related decisions.

Renal Injury: What You Need to Know

Normal Renal Function

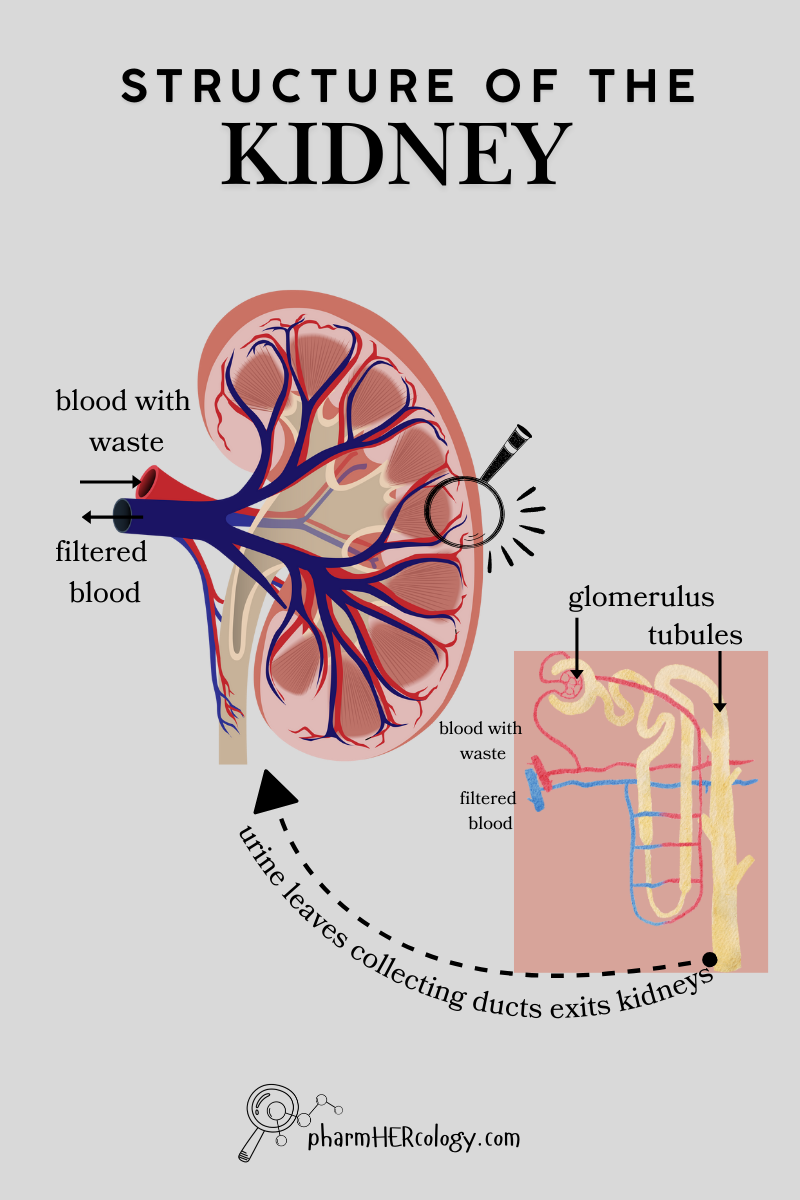
Image showing the internal structure of the kidneys, including the renal artery and veins, the glomerulus, and tubules

The kidneys has many roles including filtration of blood to remove waste.

Within the kidneys waste is filtered at the glomerulus. Waste exists the kidneys via the tubules as urine. Filtered blood is returned to the body.

Categories of Renal Injury

There are three broad categories of renal injury based on where dysfunction occurs.

Image showing the 3 broad categories of where renal injury occurs:  prerenal, intrinsic and post renal

Prerenal: dysfunction in parts prior to the kidneys that affect renal processes

Intrinsic: injury within the kidneys

Post Renal: Injury beyond the kidneys that affect renal processes

There are 5 markers that we use to distinguish between these categories of acute renal injury.

  1. The ratio of BUN to creatinine in plasma
  2. The concentration of sodium in the urine
  3. The fractional excretion of sodium
  4. The fractional excretion of urea
  5. The type of sedimentation in urine
Illustration of the 5 markers of renal injury: fraction excreted sodium, fraction excreted urea, urinary sodium, BUN/SCr, urine sediment

BUN/SCr Ratio

Comparison of BUN/SCr ratio in normal kidney function, prerenal, intrinsic and post renal injury

BUN and creatinine used for this calculation are both measured in plasma. Both are cleared by the kidneys at the glomerulus. The glomerulus is the cluster of blood vessels inside the kidneys where filtration occurs.


Prerenal

Filtration by the glomerulus depends on the difference in pressure of plasma entering and plasma leaving. Any disruption to blood flow entering the kidneys will decrease filtration. Prerenal dysfunction refers to this hypoperfusion at the glomerulus.

The cause of hypoperfusion may is isolated to the kidneys or could be systemic. As the rate of clearance slows down waste products accumulate leading to increases in both urea and creatinine.

They increase at different rates with urea accumulating faster. Therefore we see an overall increase in the ratio of the two values.

Intrinsic

When there is internal damage to the kidneys, the filtration system is damaged. You can think of it as being leaky.

More plasma solutes, including urea and creatinine move through the glomerulus resulting in lower plasma concentrations. Which means the ratio of BUN to Scr is lower than normal.

Post Renal

Post renal kidney injury is most often bladder outlet obstruction. An obstruction to the outflow of urine increases pressure at the glomerulus. This damages the sensitive vessels leading to intrinsic damage.

Because of this, post renal injury often looks like intrinsic. It is classified differently because it originates outside of the kidneys.

The increased leakiness caused by the pressure of obstruction increases plasma clearance of urea and creatinine with a corresponding decrease in the BUN/Scr ratio.

Urinary Sodium

Comparison of urinary sodium in normal kidney function, prerenal, intrinsic and post renal injury

Urinary sodium (UNa) measures sodium concentration in a spot urine sample. The concentration of sodium in urine is usually around 20mEq/L. This is sodium that has been filtered out of blood at the glomerulus in the kidneys.


Prerenal

When there is prerenal injury, there is reduced blood flow to the kidneys which is detected by angiotensin II receptors in renal tubules. The kidneys interpret decrease in flow as a decrease in blood pressure.

To compensate it will increase reabsorption of sodium and water within the kidney tubules. This results in less sodium being filtered into urine and a corresponding decrease in urinary sodium (UNa).

Intrinsic

When there is intrinsic injury in the kidneys we expect the filtration system to be more leaky than normal and so more sodium will make it into the urine. The UNa is expected to be higher than normal.

Damage to tubules within the kidneys also means there is less reabsorption of sodium. Normally almost all sodium filtered at the glomerulus is reabsorbed by the kidneys at varies tubules.

The proximal tubule reabsorbs ~60% of sodium. The loop of Henle absorbs ~25%. The convoluted tubules and collecting ducts absorb ~10%. Therefore the degree of sodium wasting is influenced by where injury in the kidney occurs. This add to the amount of sodium in urine with intrinsic injury.

Post Renal

Post renal injury leads to intrinsic injury by increasing renal pressure we would see in increase in urinary sodium with post renal injury.

Fractional Excretion of Sodium

Fractional excretion of sodium (FeNa) is measured by obtaining a plasma sample and urine sample at the same time and testing the levels of sodium and creatinine in each sample.

Imaging showing the equation for calculation of fractional excretion of sodium using urinary sodium and creatinine and serum sodium and creatinine.

Fractional excretion of sodium is the ratio of sodium in urine and plasma divided by the ratio of creatinine in urine and plasma. This is often expressed as percent (x100). It calculates the proportion that made it out of plasma and into urine.

Comparison of fractional excretion of sodium in normal kidney function, prerenal, intrinsic and post renal injury

Prerenal

When there is decreased perfusion to the glomerulus the normal filtration processes at the glomerulus and within the tubules will continue to occur. The only difference is that less sodium and less creatinine is being introduced at the glomerulus so we see a lower concentration of each in the urine.

The proportions of each in the urine and plasma will remain the same which is why the ratio does not change and FENa will appear normal even with prerenal injury.

Intrinsic

This is similar to what we saw with urinary sodium. Damage to the glomerulus results in “leaky pipes”. More sodium and creatinine is going to get through than usual.

Damage to tubules within the kidneys also means that there is going to less reabsorption of sodium. This results in a significant increase in sodium wasting.

Urinary sodium is the numerator in our FeNa equation. Its is going to have a greater increase in urinary concentration. The FENa is expected to be higher than normal with intrinsic injury.

Post Renal

Post renal calculations will mimic intrinsic calculations because the increased pressure from outlet obstruction leads to intrinsic damage. The FENa is expected to be higher than normal with post renal injury.

Fractional Excretion Urea

Fractional excretion of urea (FEU) is essentially the same as FENa except we use urea instead of sodium. It is measured by obtaining a plasma sample and urine sample at the same time and testing the levels of urea and creatinine in each sample.

Why have both? Sodium levels can be affected by alot: diuretics, chronic kidney disease, sepsis, heart failure. FENa may not be valid in those cases. The use of FEU is recommended.

Imaging showing the equation for calculation of fractional excretion of urea using urinary urea and creatinine and serum urea and creatinine.

Fractional excretion of urea is the ratio of urea in urine and plasma divided by the ratio of creatinine in urine and plasma. This is often expressed as percent (x100). It calculates the proportion that made it out of plasma and into urine.

Comparison of fractional excretion of urea in normal kidney function, prerenal, intrinsic and post renal injury

Prerenal

The mechanism is similar wat we saw with FENa. When the cause of injury is prerenal the only difference will be a decrease in the amount of urea introduced at the glomerulus for filtration. All other processes beyond the glomerulus remain intact.

The proportions of urea and creatinine in the urine and plasma will remain the same which is why the ratio does not change and FEU will appear normal even with prerenal injury.

Intrinsic

Damage to the glomerulus will cause more urea to leak through increasing the concentration of urea in urine. Urea is also “recycled” multiple times in the collecting ducts of the tubules before it is excreted into urine. Damage to the collecting duct will result in less recycling and more wasting, further increasing the amount of urea extracted into urine.

Post Renal

The build up in pressure caused by post renal injury can lead to intrinsic injury which is why the FEU values tend to be similar. The only difference is where the injury originated.

Urine Sedimentation

When a urinalysis is ordered, it involves the observation of urinary sediments microscopically. The sediments are derived by centrifuging the urine sample to separate solid components from the liquid. Those solid components are urine sedimentation.

Normal urine sedimentation includes low quantities of red blood cells, white blood cells and epithelial cells.

Comparison of urine sedimentation in prerenal, intrinsic and post renal injury

Abnormal sediments found in urine during acute renal injury are the result of dead renal tissue that sloths off and is eliminated in urine.


Prerenal

In acute prerenal dysfunction there is only decreased perfusion. All tissues within the kidneys remain in tact. Urine sedimentation remains normal.

Intrinsic

In intrinsic dysfunction there actual damage to tissues within the kidneys. Medications like aminoglycosides can absorb into the cells of the kidneys and cause necrosis. The cells die, sloth off and are eliminated in urine. Inflammation within the kidneys caused by autoimmune diseases or infection causes an influx of immune modulators that can directly damage tubules and glomeruli.

When there is damage to tissue within the kidneys muddy brown granular cast and renal epithelial cells from dead kidney cells are present on urinalysis.

Post Renal

The degree to which post renal obstruction causes intrinsic damage determines the degree of sedimentation that will be observed on urinalysis. It can range from normal to casts and epithelial cells.

I hope this unit has provided clarity on how we distinguish the 3 types of acute kidney injury based on the origin of dysfunction. Now you have a good foundation to dive into the AKI guidelines and renal supplementation strategies. If you’ve found this unit helpful I would love to hear from you. Leave a question or comment below!

Subscribe

Subscribe to get the latest study unit in your inbox.

The information on this website is intended to be used solely for educational and informational purposes. While the content may be about specific medical and health care issues, it is not a substitute for or replacement of personalized medical advice and is not intended to be used as the sole basis for making individualized medical or health-related decisions.

MUDPILES: The One Shared Trait that Leads to Acidosis

MUDPILES is a long-standing acronym that is used to quickly recall the likely causes of high anion gap metabolic acidosis but it usually stops right there. How do the components cause acidosis? Why is it important to know the how?

Understanding vs Memorizing

As our patients increasingly present with more complex comorbidities the straight pathway to correction of pathologies is becoming more twisted. The body is one big continuous chemical reaction, one pathology bleeds into the next and it is becoming increasingly difficult to apply the strict recommendations of clinical guidelines to very complex patients. If we understand the mechanics of these pathologies rather than just know what they are, we are better able to respond to unique patient presentations.

Organic Acids

Plasma is 92% water. In plasma an organic acid will dissolve, releasing its hydrogen ion (H+) and becoming an anion. The increase in hydrogen ions increases acidity (lower pH). The increase in anions increases the calculated anion gap because they are not accounted for in the anion gap equation. This is the basis for the occurrence of high anion gap metabolic acidosis.

Illustration showing how organic acids dissolve in plasma to produce an acid and an anion.

As you will see, many of the causes of high anion gap metabolic acidosis are secondary to the production of varying organic acids. These acids accumulate due to impaired clearance or are introduced into the body in overwhelming quantities.

Organic acids all share the common molecular structure:

Image showing the common carboxyl group that all organic acids share.

Anion Gap

Understanding how the anion gap is calculated and its interpretation with regards to plasma’s electrical neutrality is necessary for understanding how these organic acids will lead to an increase in the anion gap.

Calculated anion gap looks at the difference between predominant cations and anions to provide a normal value of 4-12mEq/ml. Any anions not included in the equation will increase the anion gap as it accumulates.

The unit Anion Gap has everything you need to truly understand this concept.

MUDPILES

The components of MUDPILES are:

Illustration showing the components of MUDPILES acronym.

How does methanol cause acidosis?

Methanol is an alcohol used commercially in the production of fuel, windshield washer fluid and as a solvent in inks and dyes. It is poisonous when consumed or when its vapors are inhaled in high concentrations.

When methanol enters the body it is oxidized into formic acid. Formic acid is an organic acid that will dissolve in plasma to form the anionic formate ion by releasing acidic hydrogen ions. Thus increasing both acidity and the anion gap leading to high anion gap metabolic acidosis.

Equation showing how methanol is converted by the body into an organic acid and then into an anion and acidic hydrogen ion.

How does uremia cause acidosis?

When protein is metabolized it produces ammonia, which is a toxic by-product. The liver converts ammonia to urea which is then cleared by the kidneys. When kidney function is impaired urea accumulates in plasma resulting in uremia.

Urea is neither acidic nor basic. In reality is has no real effect on the bloods pH. It is really just a measurable surrogate marker for organic compounds that are also cleared by the kidneys. If urea is not being cleared, these organic compounds are also not being cleared. These other organic compounds are acidic. They include sulfates and phosphates.

In plasma, organic acids will release their hydrogen ions, increasing acidity causing metabolic acidosis. While the accumulation of the accompanying anion will increase the calculated anion gap.

illustration showing how uremia causes high anion gap metabolic acidosis. It starts with the metabolism of protein that produces ammonia. Ammonia is a toxic by product, it gets converted to urea. Urea is them cleared by the kidneys along with organic acids like sulfates and phosphates.

How does DKA cause acidosis?

DKA refers to diabetic ketoacidosis. In the absence of sufficient insulin to convert glucose into energy the liver will convert fat to energy instead. A byproduct of this conversion is ketones.

Ketogenesis is a normal biological process. Under normal conditions ketones are readily cleared by the kidneys. However ketogenesis is intended to be temporary compensation for short periods of insufficient insulin and/or glucose. When the body remains in ketogenesis for too long, this can lead to toxic accumulation that the kidneys are not able to handle.

Ketones are organic acids. Therefore in plasma they will dissociate into acidic hydrogen ions and organic anions. As both accumulate, acidity and the anion gap will also increase.

Illustration showing how diabetic ketoacidosis leads to the accumulation so ketones. Ketones a re organic acids that lead to metabolic acidosis and an increase in the anion gap.

How does propylene glycol cause acidosis?

Propylene glycol is a synthesized clear liquid used across many industries including pharmaceutical and food industries because of its ability to absorb and maintain moisture in medicines and foods. It is also used as an alternative to ethylene glycol in antifreeze. Propylene glycol is also the main compound in artificial smoke used at concerts and shows.

Propylene glycol can cause toxicity when it is encountered in high concentrations. This can occur as an occupational hazard or from prolonged exposure to artificial smoke in enclosed spaces. In medicine, propylene glycol toxicity can occur when large doses of intravenous benzodiazepines like lorazepam and IV phenytoin are given over a prolonged period of time or as a continuous infusion.

When propylene glycol is absorbed by the body, it is converted by the liver to lactic acid. Under normal conditions, lactic acid can be cleared by the body. Lactic acid will dissolve to release its hydrogen ion and anionic lactate ion. When present in large quantities this will increase acidity and the calculated anion gap respectively causing high anion gap metabolic acidosis.

Illustration showing how propylene glycol is converted to lactic acid in the body. Lactic acid dissolves in plasma to form that lactate anion and acidic hydrogen ions.

How does Isoniazid cause acidosis?

Isoniazid is an antibiotic used to treat tuberculosis. Toxicity has been reported with both therapeutic and toxic doses. Acute isoniazid toxicity presents primarily as seizures. It is those seizures that leads to an accumulation of lactic acid and progression to severe lactic acidosis.

The recurrent and intense muscle contractions that occur during a seizure results in anaerobic metabolism, a byproduct of which is lactic acid. Isoniazid toxicity is associated with recurrent seizures overwhelming the body’s normal mechanisms for clearing lactate leading to accumulation.

Again lactic acid will dissolve in plasma to release its hydrogen ions and anionic lactate ion. In large concentrations, this will cause metabolic acidosis and an increase in the anion gap.

Illustration showing how the seizures that occur with isoniazid toxicity increases anabolic metabolism increasing lactic acid production. Latic acid will dissolve in plasma to produce acidic hydrogen ion (metabolic acidosis) and anionic lactate which increases the anion gap.

How does Iron cause acidosis?

Iron is available over the counter and cause toxicity when excess amounts are ingested especially by curious kids. The 2023 annual report from the National Poison Data System lists iron among fatal pharmaceutical exposures for that year.

Iron can cause acidosis in multiple ways. On a cellular level accumulation will disrupt ATP (the energy source of cells) forcing the cells to use anaerobic metabolism. This will increase lactic acid.

Consuming large amount of iron will also have very corrosive effects on the gastrointestinal tract with symptoms ranging from nausea and vomiting to gastrointestinal bleeds and hypovolemic shock. All of these will decrease perfusion and increase lactic acid.

Just as we’ve seen, the accumulation of lactic acid will lead to an accumulation of acidic hydrogen ion and anion lactate, increasing acidity (metabolic acidosis) and the calculated anion gap.

How does lactic acid cause acidosis?

So far we have seen via iron, isoniazid and propylene glycol that any process that will increase the body’s accumulation of lactic acid or decrease its clearance will lead to acidosis and an increase in the anion gap.

Image showing how lactic acid exist in plasma as a lactate anion which will increase the anion gap with accumulation and a hydrogen ion which will increase acidity (metabolic acidosis).

The L in MUDPILES reserves a spot for any condition or drug that has the potential to increase lactic acid and cause metabolic acidosis. Lactic acid accumulation can occur:

  • any time the body is deprived of oxygen for a prolonged period of time
  • when organs or systems that would normally facilitate its clearance are impaired
  • as an adverse effect from the routine use of medications
  • many other causes including intentional and unintentional poisoning

How does ethylene glycol cause acidosis?

Ethylene glycol is the main component in antifreeze. Like propylene glycol it is used commercially in manufacturing and cosmetics industries because of its ability to absorb and maintain moisture. It is considered a hazardous substance.

Once absorbed ethylene glycol is metabolized by the liver into glycolaldehyde. Glycolaldehyde is then metabolized into multiple organic acids including glyoxylic acid and formic acid.

We see again that these organic acids will increase the concentration of hydrogen ions which increases acidity (metabolic acidosis) and increases the concentration of organic anions which increases the anion gap.

Illustration showing how ethylene glycol is converted to organic aids that increase acidity (metabolic acidosis) and anions to increase the anion gap.

How do salicylates cause acidosis?

In medicine salicylates refer to aspirin. Aspirin is used in treatment of pain, inflammation and to reduce the risk of strokes and heart attacks. Methyl salicylate as the plant wintergreen, is used in traditional medicine to reduce pain and inflammation. Salicylates remain among the top exposures according to the 2023 Annual Report of the National Poison Data System.

Accumulation of salicylates can interrupt normal cellular pathways in multiple ways leading to the build up of lactic acid which contributes to acidosis. Salicylates themselves are weak acids. In plasma they will exist as hydrogen ions and anions leading to metabolic acidosis and an increased anion gap.

The common thread among the elements of MUDPILES is the accumulation of organic acids leading to acidosis.

I hope this unit has helped to expand your knowledge of MUDPILES beyond simple memorization. If you have found this unit helpful, I would love to hear from you! Leave a comment or question below.

Subscribe

Subscribe to get the latest study unit in your inbox.

The information on this website is intended to be used solely for educational and informational purposes. While the content may be about specific medical and health care issues, it is not a substitute for or replacement of personalized medical advice and is not intended to be used as the sole basis for making individualized medical or health-related decisions.

Anion Gap & Neutrality: Filling in the Knowledge Gap

The anion gap is a calculation that measures the balance of select negative and positive charges (anion and cations respectively) in plasma. Anion gap is critical for the assessment of acid -base disorders which is an umbrella diagnosis that has many causes including renal failure, toxicities, sepsis and diabetic ketoacidosis.

Though the name suggests there is a “gap” in the number cations and anions, this is not the case.

Ion Balance

Plasma has a balanced amount of cations and anions; it is electrically neutral. The overall charge is near zero.

The most abundant cations are sodium (Na+) and potassium (K+). The most abundant anions are chloride (Cl-) and bicarbonate (HCO3-). These are commonly referred to as electrolytes.

image of human body showing the balance of positive and negative ions. It also contains a chart with the concentration of the most abundant ions in the body in descending order.

Notice that these concentrations in the image above are listed in descending order. The highest concentration of ions in the body is that of sodium, followed by chloride, bicarbonate and finally potassium.

The amount of sodium exceeds that of chloride and bicarbonate combined. These ions are considered the most critical ions for the maintenance of homeostasis. They are the select electrolytes used in the calculation of anion gap.

Diagram showing the relative abundance of ions and cations in the body on a line graph.

Anion Gap & Neutrality

Let’s clear up the confusing terminology. If plasma is electrically neutral how can a gap exist between the number of cations and anions?

The gap is calculated. It exists because we are only using the predominant electrolytes to calculate this value. In reality there is no gap. In addition to the ions used in the equation there are “other” anions and cations that ensure plasma remains electrically neutral.

Illustration showing the difference between the calculated anion gap and the reality of ion distribution in the body. 
In reality there is no gap of ion in the body.

The plasma anions not included in the equation have relatively insignificant quantities compared to chloride and bicarbonate. Phosphates, sulfates and proteins make small contributions to the negative charge of plasma. Albumin is the most abundant negatively charged protein in plasma.

Likewise, there are cations are that are not included in the equation. Magnesium and calcium are other cations in plasma that contribute to the total positive charge but are not included in the anion gap equation because of their relatively insignificant concentrations.

If we included ALL the cations and ALL the anions in the anion gap equation there would be no gap. Instead we consider only the most significant contributors to plasma electrolyte composition.

In reality, the true anion gap equation is:

Illustration with the equation for true anion gap where all the cations and anions in plasma are considered resulting in a net charge of zero.
OC = other cations in plasma, OA = other anions in plasma

Watch on YouTube

Anion Gap Equation

Illustration showing the equation for the calculated anion gap that includes only sodium, chloride and bicarbonate.

Anion gap is calculated as the difference between the concentrations of predominant cations and anions. You may see this equation with potassium included:

K+ is often excluded because of its very low concentration relative to the other ions. In fact, the concentration of sodium exceeds all “other cations” to such a degree that “other cations” are rarely considered to contribute to the anion gap except in cases of toxicity where external positively charged particles are introduced into the body. An example being lithium (Li+) toxicity.

Lexicomp and MDcalc provide calculators for anion gap.

Interpretation of Results

A normal anion gap is any value between 4-12mEq/ml. Because the amount of sodium exceeds the combined amount of bicarbonate and chloride, the value is positive.

If we think of this equation mathematically, it would suggests that the difference calculated tells us how much more cations there are than anions. Mathematically, it does. However we must interpret the calculated value together with the rule of plasma neutrality.

There can be no such thing as more positive charges. There must be something present in plasma, not accounted for by the equation, that is going to equal that excess positive charge. This is the “other anions” which makes up the anion gap. The most abundant “other anion” is albumin.

illustration showing that the anion gap calculated is really a reflection not of imbalance in positive and negative ion but rather give a value to the "other anions" that maintain the electrical neutrality of plasma.

The calculated anion gap is not an indication of imbalance of charges but rather it gives a numerical value to the “other” anions that are maintaining the balance of opposing charges in plasma. Understanding this is crucial to understanding anion gap calculations.

Clinical Scenarios

Interpretation of anion gap cannot be considered in isolation. Pathologies can occur when the anion gap it too high, too low but also when it is within the normal range.

Illustration of the 3 clinical scenarios that can occur with your anion gap. It can remain normal, it can be too high or too low.

Because the anion gap represents “other anions” when they are low the anion gap will decrease. Since albumin is the most abundant “other anion” hypoalbuminemia is the most common cause of a low anion gap.

The effect of the predominant electrolytes on the anion gap is because of their ability to alter pH.

The main pH buffering system in the body centers around bicarbonate and therefore its concentration is most commonly affected by acid-base disorders. Chloride is the main contingency anion to counteract bicarbonate imbalances and maintain neutrality.

Illustration showing the equation for the main buffering system of the blood. Bicarbonate is a necessary component of the blood buffering system.
Illustration showing that chloride and bicarbonate work together to maintain pH. As the concentration of one decreases the other will increase and vice versa. Because they are both included in the anion gap equation, the anion gap value does not fall out of range.

Cl and HCO3 will always compensate for each other.

When the anion gap is normal there are 3 possible scenarios.

  1. Cations and anions are at normal concentrations: no pathology
  2. Bicarbonate is low and chloride is compensating with an increase in its concentration
  3. Bicarbonate is high and chloride is compensating with a decrease in its concentration

Ion-pH Connection

A normal anion gap is directly related to the maintenance of normal plasma pH. Chloride is a weak base. Bicarbonate is a weak base. As their concentrations decrease pH will decrease (more acidic).

Illustration showing how cations, even though they are neither acidic or basic affects pH. They do this my regulating the outflow of acidic hydrogen ions out of cells and into plasma via ion transporters. As the concentration of hydrogen ions in plasma increases pH drops, resulting in increased acidity.

Sodium and potassium are neither acidic nor basic. However they both regulate the transport of acidic hydrogen ions (H+) across the cell membrane.

Sodium achieves this via the Na+/H+ transporter located on cell membranes. As sodium moves in, H+ moves out (increased acidity).

Potassium achieves this via the K+/H+ transporter. As potassium moves in, hydrogen moves out (increased acidity).

This is why the anion gap is always so closely tied to acid-base disorders. Unfortunately, acid-base disorders dominate the discussion. The true mechanics of the anion gap, which is the foundation of acid-base disorders are seldom explained.

This unit explains the core of anion gap calculations. Can it get more complicated? Absolutely. But, if you can understand calculated anion gap as a combined mathematical and electrical neutrality concept, you can then apply it to more complicated scenarios.

My hope is that this unit helps with true understanding rather than simple memorization of an equation. If you’ve found this unit helpful, I would love to hear from you. Leave your comment or question below.

Subscribe

Subscribe to get the latest study unit in your inbox.

The information on this website is intended to be used solely for educational and informational purposes. While the content may be about specific medical and health care issues, it is not a substitute for or replacement of personalized medical advice and is not intended to be used as the sole basis for making individualized medical or health-related decisions.